Create a quantile-quantile plot for one or more numeric variables.
Usage
plot_qq(
  data,
  x,
  facet_var = NULL,
  facet_scale = "free",
  facet_nrow = NULL,
  facet_ncol = NULL,
  color = NULL,
  title = NULL,
  subtitle = NULL,
  xlab = NULL,
  ylab = NULL,
  caption = NULL,
  point_size = 2,
  point_shape = 16,
  point_color = "grey35",
  point_fill = "grey35",
  point_alpha = 0.25,
  line_width = 0.25,
  line_type = "solid",
  line_color = "grey35",
  line_alpha = 1,
  band_color = "grey35",
  band_alpha = 0.25,
  theme_set = theme_tscv(),
  theme_config = list(),
  ...
)
Arguments
- data
A
data.frame,tibble, ortsibblein long format.- x
Unquoted column in
datacontaining numeric values.- facet_var
Optional unquoted column in
dataused for faceting.- facet_scale
Character value defining facet axis scaling. Common values are
"free","fixed","free_x", and"free_y".- facet_nrow
Optional integer. Number of rows in the facet layout.
- facet_ncol
Optional integer. Number of columns in the facet layout.
- color
Optional unquoted column in
dataused to map point, line, and confidence-band colors.- title
Character value. Plot title.
- subtitle
Character value. Plot subtitle.
- xlab
Character value. Label for the x-axis.
- ylab
Character value. Label for the y-axis.
- caption
Character value. Plot caption.
- point_size
Numeric value defining the point size.
- point_shape
Numeric or character value defining the point shape.
- point_color
Character value defining the point outline color. Ignored when
coloris supplied.- point_fill
Character value defining the point fill color. Ignored when
coloris supplied.- point_alpha
Numeric value between
0and1defining point transparency.- line_width
Numeric value defining the qq-line width.
- line_type
Character or numeric value defining the qq-line type.
- line_color
Character value defining the qq-line color. Ignored when
coloris supplied.- line_alpha
Numeric value between
0and1defining line transparency.- band_color
Character value defining the confidence-band fill color. Ignored when
coloris supplied.- band_alpha
Numeric value between
0and1defining confidence-band transparency.- theme_set
A complete
ggplot2theme.- theme_config
A named
listwith additional arguments passed toggplot2::theme().- ...
Further arguments passed to
qqplotr::stat_qq_point(),qqplotr::stat_qq_line(), andqqplotr::stat_qq_band().
Details
plot_qq() is a convenience wrapper around the qqplotr
functions stat_qq_point(), stat_qq_line(), and
stat_qq_band(). It is useful for checking whether values, residuals,
or forecast errors approximately follow a theoretical distribution.
By default, the function creates a normal quantile-quantile plot with pointwise confidence bands.
The arguments x, facet_var, and color are passed as
unquoted column names.
If color is supplied, point colors, line colors, and confidence-band
fills are mapped to that variable. In this case, point_color,
point_fill, line_color, and band_color are ignored.
If color is not supplied, the fixed styling arguments are used.
Additional arguments can be passed to the underlying qqplotr
statistics through ..., for example distributional arguments supported
by qqplotr.
Additional theme settings can be supplied through theme_config. This
should be a named list of arguments passed to ggplot2::theme().
See also
Other data visualization:
plot_bar(),
plot_density(),
plot_histogram(),
plot_line(),
plot_point(),
scale_color_tscv(),
scale_fill_tscv(),
theme_tscv(),
tscv_cols(),
tscv_pal()
Examples
library(dplyr)
data <- M4_monthly_data |>
filter(series %in% c("M23100", "M14395"))
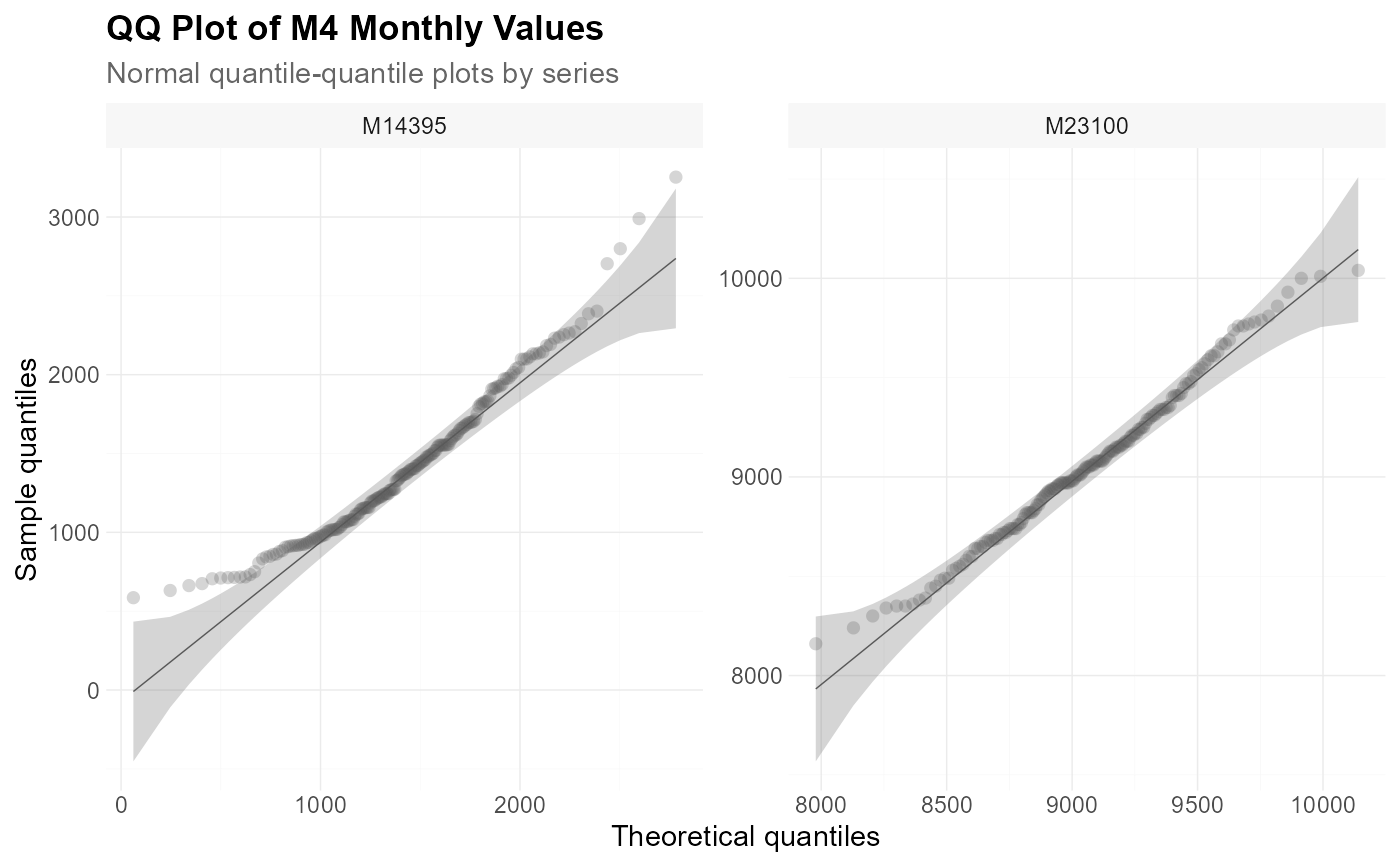
plot_qq(
data = data,
x = value,
facet_var = series,
title = "QQ Plot of M4 Monthly Values",
subtitle = "Normal quantile-quantile plots by series",
xlab = "Theoretical quantiles",
ylab = "Sample quantiles"
)
 stats <- data |>
group_by(series) |>
mutate(value_centered = value - mean(value, na.rm = TRUE)) |>
ungroup()
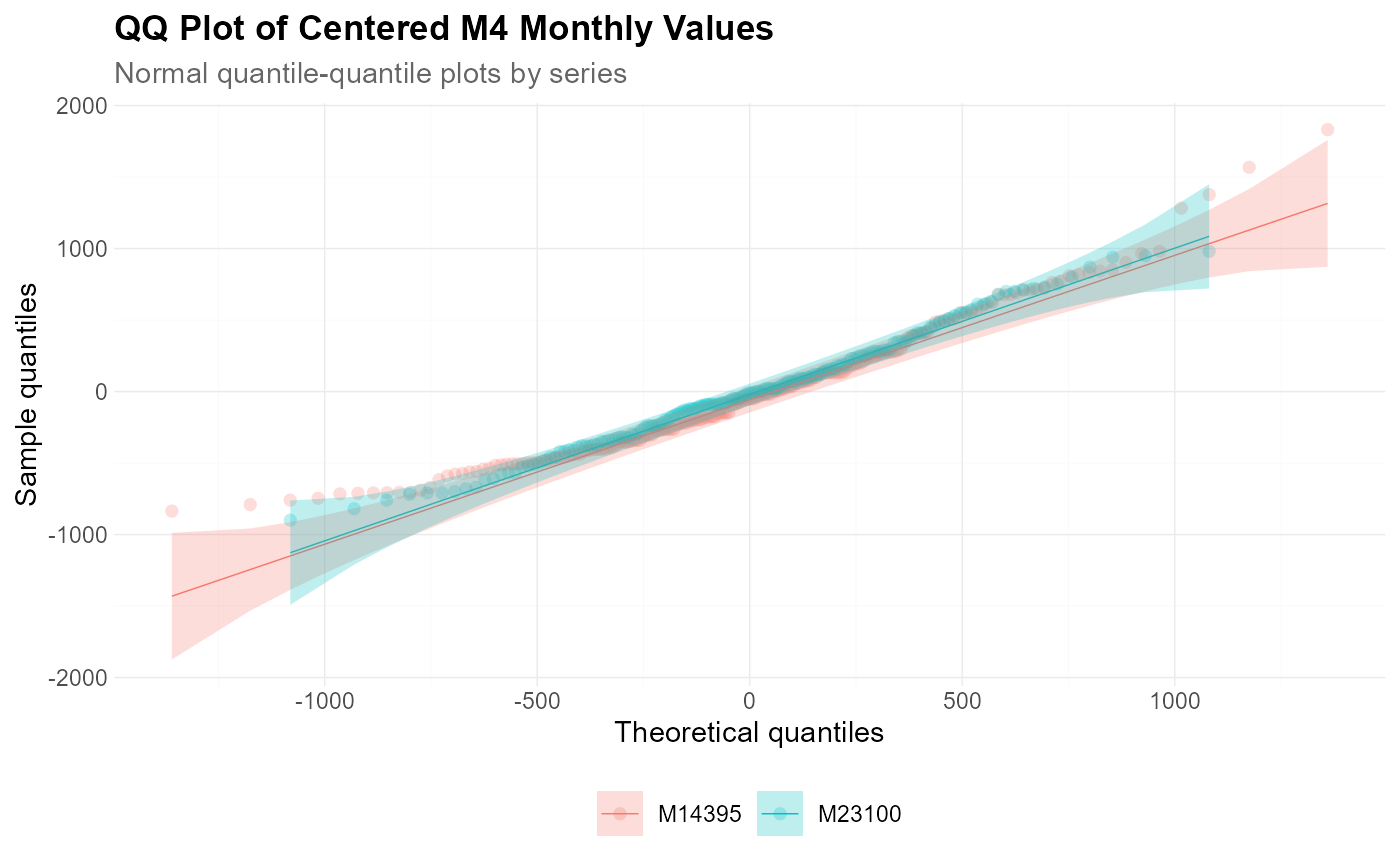
plot_qq(
data = stats,
x = value_centered,
color = series,
title = "QQ Plot of Centered M4 Monthly Values",
subtitle = "Normal quantile-quantile plots by series",
xlab = "Theoretical quantiles",
ylab = "Sample quantiles"
)
stats <- data |>
group_by(series) |>
mutate(value_centered = value - mean(value, na.rm = TRUE)) |>
ungroup()
plot_qq(
data = stats,
x = value_centered,
color = series,
title = "QQ Plot of Centered M4 Monthly Values",
subtitle = "Normal quantile-quantile plots by series",
xlab = "Theoretical quantiles",
ylab = "Sample quantiles"
)