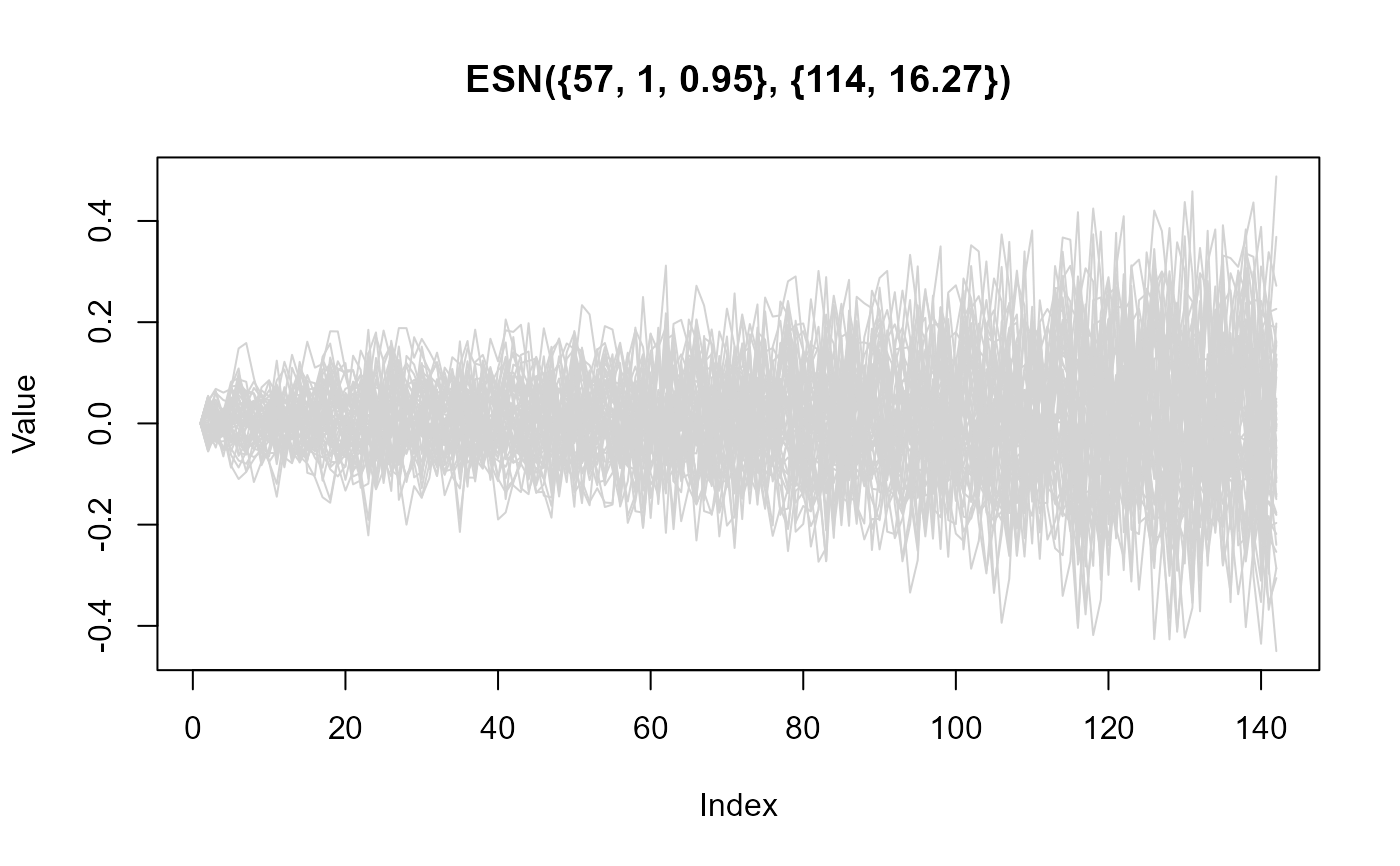
Plot internal states (i.e., the reservoir) of a trained ESN model as line chart.
Usage
# S3 method for class 'esn'
plot(x, ...)
Arguments
- x
An object of class
esn. The result of a call totrain_esn().- ...
Further arguments passed to
matplot().
See also
Other base functions:
forecast_esn(),
is.esn(),
is.forecast_esn(),
is.tune_esn(),
plot.forecast_esn(),
plot.tune_esn(),
print.esn(),
summary.esn(),
summary.tune_esn(),
train_esn(),
tune_esn()
Examples
xdata <- as.numeric(AirPassengers)
xmodel <- train_esn(y = xdata)
plot(xmodel)