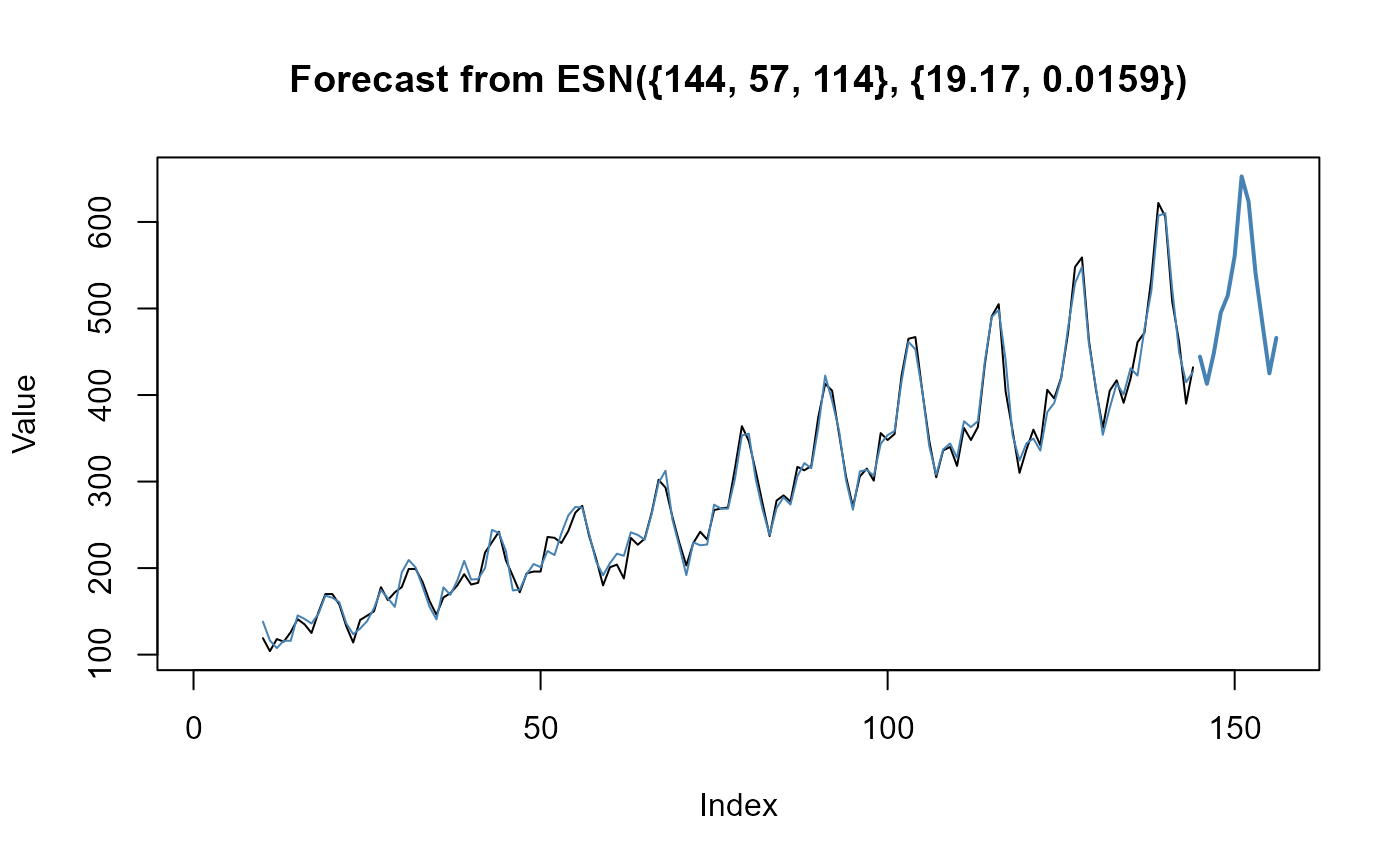
Plot point forecasts and forecast intervals, actual values of a trained ESN model. Optionally, test data (out-of-sample) and fitted values can be added to the plot.
Usage
# S3 method for class 'forecast_esn'
plot(x, test = NULL, fitted = TRUE, interval = TRUE, n_obs = NULL, ...)
Arguments
- x
An object of class
forecast_esn. The result of a call toforecast_esn().- test
Numeric vector. Test data, i.e., out-of-sample actual values.
- fitted
Logical value. If
TRUE, fitted values are added.- interval
Logical value. If
TRUE, forecast intervals are added.- n_obs
Integer value. If
NULL, all in-sample values are shown, otherwise only the lastn_obs.- ...
Further arguments passed to
plot().
See also
Other base functions:
forecast_esn(),
is.esn(),
is.forecast_esn(),
is.tune_esn(),
plot.esn(),
plot.tune_esn(),
print.esn(),
summary.esn(),
summary.tune_esn(),
train_esn(),
tune_esn()
Examples
xdata <- as.numeric(AirPassengers)
xmodel <- train_esn(y = xdata)
xfcst <- forecast_esn(xmodel, n_ahead = 12)
plot(xfcst)