Create a ggplot2 fill scale based on a predefined tscv palette.
Arguments
- palette
Character value. Name of the palette.
- discrete
Logical value. If
TRUE, create a discrete fill scale. IfFALSE, create a continuous fill scale.- reverse
Logical value. If
TRUE, the palette is reversed.- ...
Additional arguments passed to
ggplot2::discrete_scale()orggplot2::scale_fill_gradientn().
Details
scale_fill_tscv() creates either a discrete or continuous fill scale
for the fill aesthetic.
For discrete variables, the function uses ggplot2::discrete_scale().
For continuous variables, it uses ggplot2::scale_fill_gradientn().
Available palettes are "main", "cool", "hot",
"mixed", and "grey".
See also
Other data visualization:
plot_bar(),
plot_density(),
plot_histogram(),
plot_line(),
plot_point(),
plot_qq(),
scale_color_tscv(),
theme_tscv(),
tscv_cols(),
tscv_pal()
Examples
library(dplyr)
context <- list(
series_id = "series",
value_id = "value",
index_id = "index"
)
data <- M4_monthly_data |>
filter(series %in% c("M23100", "M14395"))
stats <- summarise_stats(
.data = data,
context = context
)
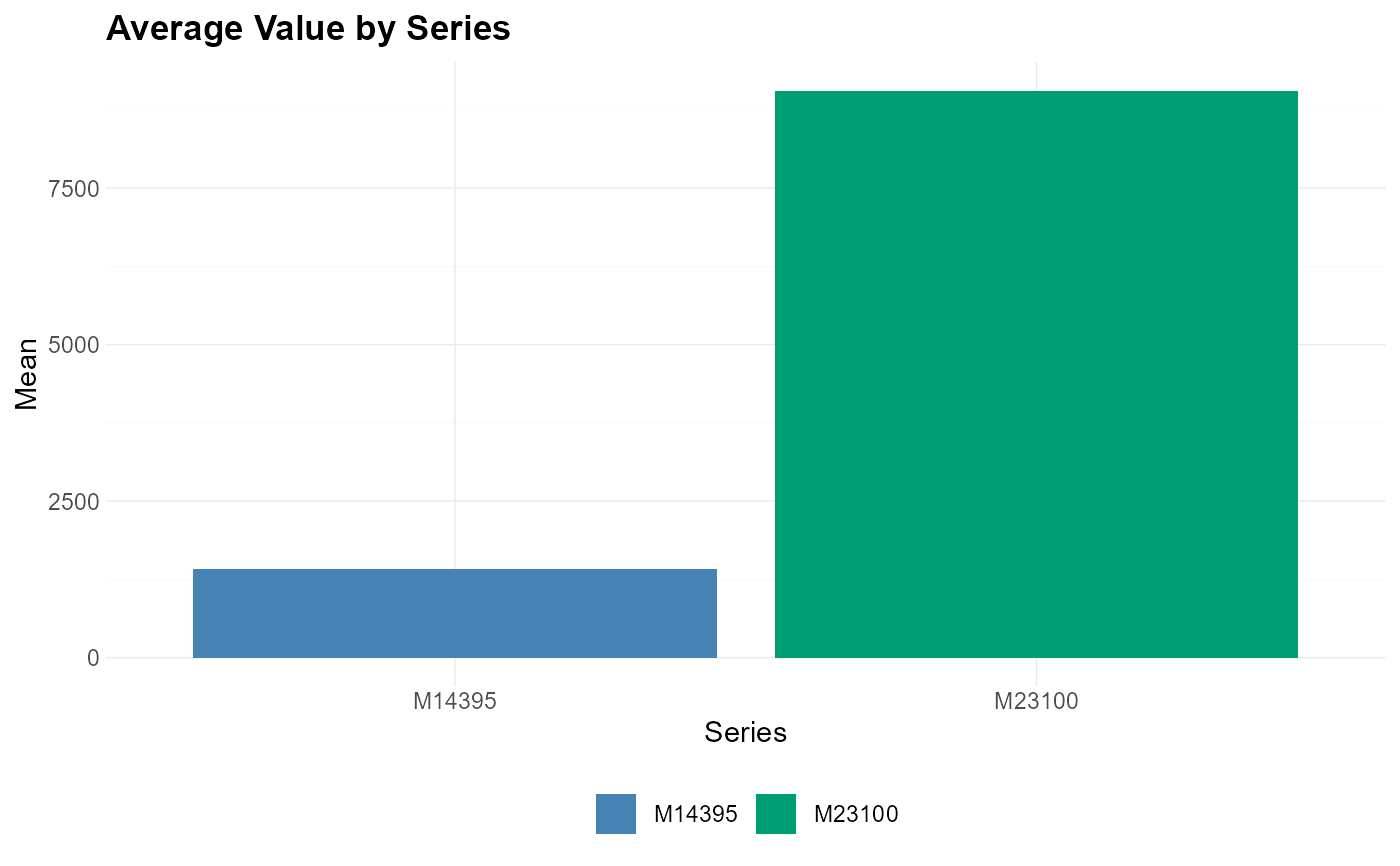
plot_bar(
data = stats,
x = series,
y = mean,
color = series,
title = "Average Value by Series",
xlab = "Series",
ylab = "Mean"
) +
scale_fill_tscv(palette = "main")