Create a color interpolation function based on one of the predefined
tscv palettes.
Arguments
- palette
Character value. Name of the palette.
- reverse
Logical value. If
TRUE, the palette is reversed.- ...
Additional arguments passed to
grDevices::colorRampPalette().
Details
tscv_pal() returns a palette function created with
grDevices::colorRampPalette(). The returned function can be used to
generate any number of colors from the selected palette.
Available palettes are:
"main": blue, green, yellow."cool": blue, green."hot": yellow, orange, red."mixed": blue, green, yellow, orange, red."grey": light grey, dark grey.
See also
Other data visualization:
plot_bar(),
plot_density(),
plot_histogram(),
plot_line(),
plot_point(),
plot_qq(),
scale_color_tscv(),
scale_fill_tscv(),
theme_tscv(),
tscv_cols()
Examples
# Create a palette function
pal <- tscv_pal("main")
# Generate five colors
pal(5)
#> [1] "#4682B4" "#96905A" "#E69F00" "#739E39" "#009E73"
# Reverse the palette
tscv_pal("hot", reverse = TRUE)(5)
#> [1] "#F0E442" "#E2A121" "#D55E00" "#DD7E00" "#E69F00"
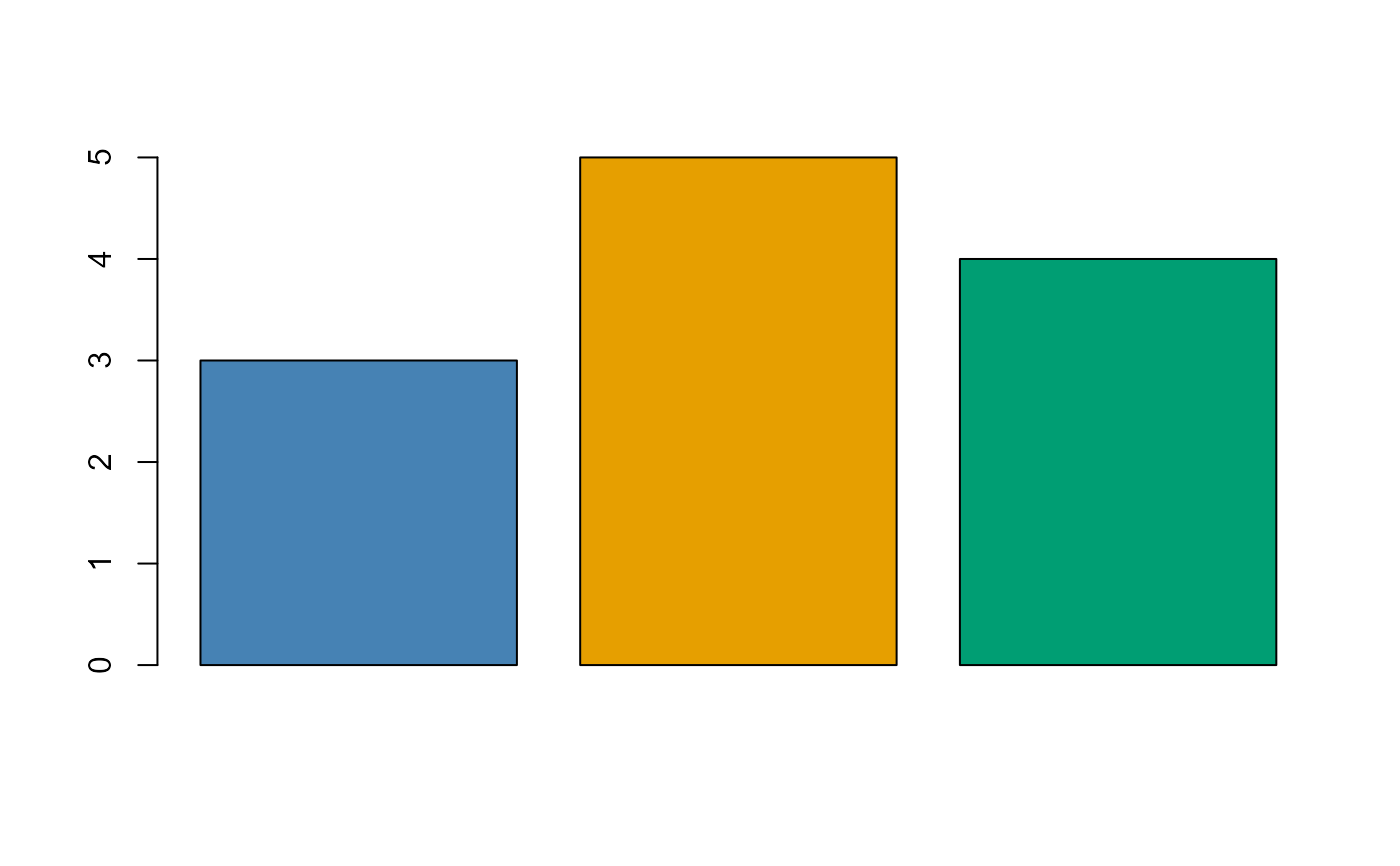
# Use generated colors in base R
barplot(
height = c(3, 5, 4),
col = tscv_pal("main")(3)
)