Extract named colors from the tscv color palette as hexadecimal color
codes.
Details
tscv_cols() returns the hexadecimal color codes used by the
tscv package. If no color names are supplied, all available colors are
returned.
Available colors are:
"red", "green", "blue", "orange",
"yellow", "light grey", and "dark grey".
See also
Other data visualization:
plot_bar(),
plot_density(),
plot_histogram(),
plot_line(),
plot_point(),
plot_qq(),
scale_color_tscv(),
scale_fill_tscv(),
theme_tscv(),
tscv_pal()
Examples
# Return all available tscv colors
tscv_cols()
#> steelblue orange green purple red skyblue yellow
#> "#4682B4" "#E69F00" "#009E73" "#7B3294" "#D55E00" "#56B4E9" "#F0E442"
#> dark grey light grey
#> "#4D4D4D" "#D9D9D9"
# Return selected colors
tscv_cols("steelblue", "orange", "green")
#> steelblue orange green
#> "#4682B4" "#E69F00" "#009E73"
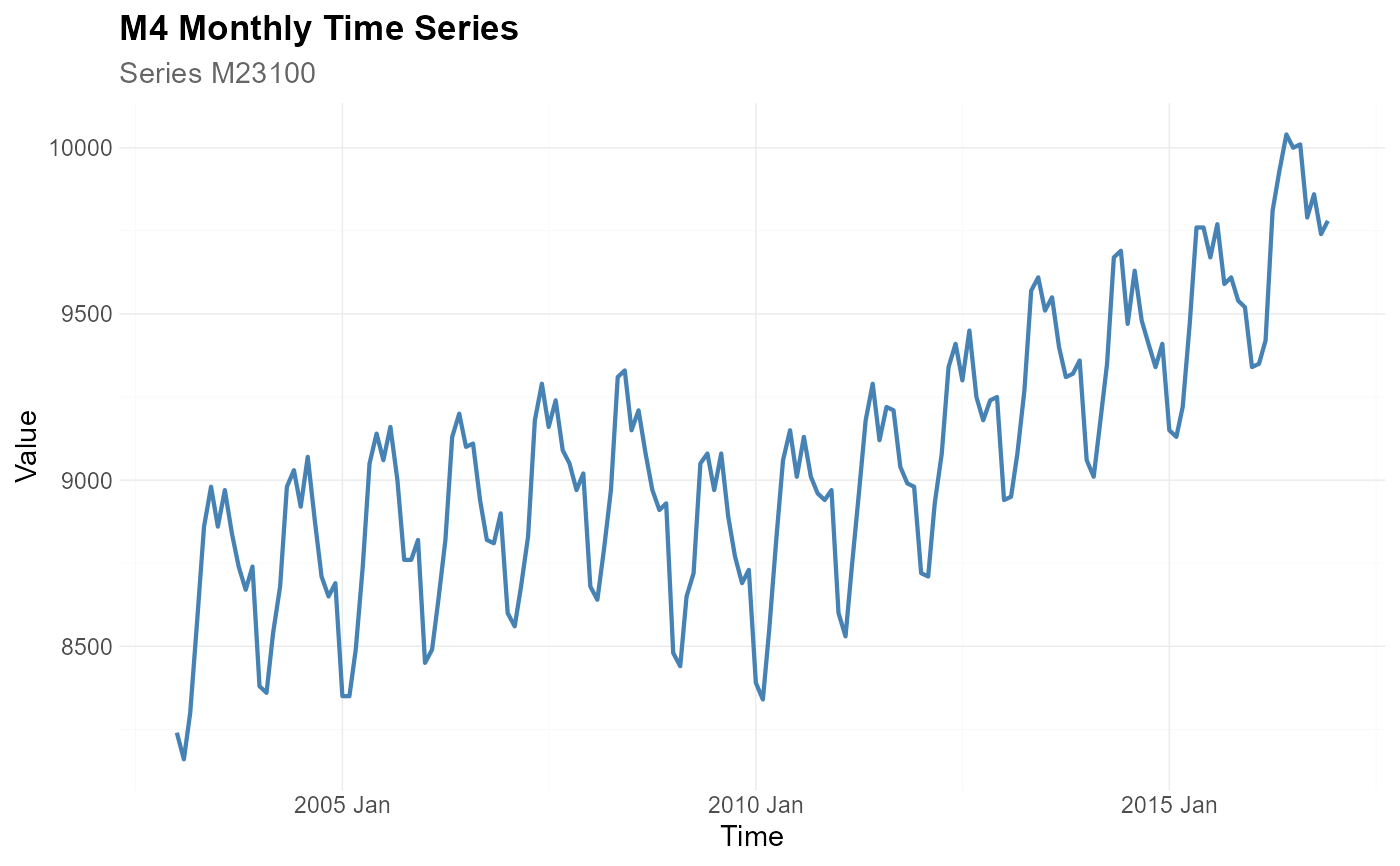
# Use a tscv color in a plot
library(dplyr)
data <- M4_monthly_data |>
filter(series == "M23100")
plot_line(
data = data,
x = index,
y = value,
title = "M4 Monthly Time Series",
subtitle = "Series M23100",
xlab = "Time",
ylab = "Value",
line_color = tscv_cols("steelblue")
)